On-device metrics monitor
The metrics monitor (available from qbee-agent version 2024.36) allows simple monitoring of certain system metrics by comparing them to a set threshold. If the system metric exceeds the threshold, a log message with severity WARN will be sent to the qbee backend. This log message can again result in a user notification if that has been configured.
Qbee allows for monitoring of many of the same metrics as we display graphs for. One of the key advantages with metrics monitoring is that it does not depend on metrics collection being switched on. This allows for monitoring metrics on the devices without constantly sending metrics data to the backend. This reduces the amount of data travelling over the network and might in turn result in a substantial saving for high cost network connectivity.
How does it work?
When a system metric is equial or has exceeded a configured threshold, the qbee-agent will create a log entry and store the state of the metric. System metrics that are in triggered state will not be considered on subsequent qbee-agent runs. Once the system metric falls below the configured threshold, the metric state will be cleared. Re-configuring the system metric threshold will also clear the state.
Available system metrics
cpu:user
Description:    The percentage of time cpu spends in user space
Treshold value: 0-100
Resource id:    none
cpu:system
Description:    The percentage of time cpu spends in system space
Treshold value: 0-100
Resource id:    none
cpu:iowait
Description:    The percentage of time cpu waits for I/O
Treshold value: 0-100
Resource id:    none
memory:memutil
Description:    The percentage of total memory currently in use
Treshold value: 0-100
Resource id:    none
memory:swaputil
Description:    The percentage of total swap currently in use
Treshold value: 0-100
Resource id:    none
filesystem:use
Description:    The percentage of filesystem use of a certain partition
Treshold value: 0-100
Resource id:    required and needs to be a filesystem mountpoint (eg. / or /data)
loadavg_weighted:1min
Description:    The system load average for the last minute
Treshold value: 0-
Resource id:    none
loadavg_weighted:5min
Description:    The system load average for the last 5 minutes
Treshold value: 0-
Resource id:   none
loadavg_weighted:15min
Description:    The system load average for the last 15 minutes
Treshold value: 0-
Resource id:    none
network:rx_bytes
Description:    Received bytes on a network interface between agent intervals
Treshold value: 0-
Resource id:    required and needs to be a configure network interface (eg. eth0)
network:rx_bytes
Description:    Transmitted bytes on a network interface between agent intervals
Treshold value: 0-
Resource id:    required and needs to be a configure network interface (eg. eth0)
temperature:temperature
Description:    Temperature in Celsius reported by temperature sensors
Treshold value: 0-
Resource id:    required and currently can only have the value cpu_temp
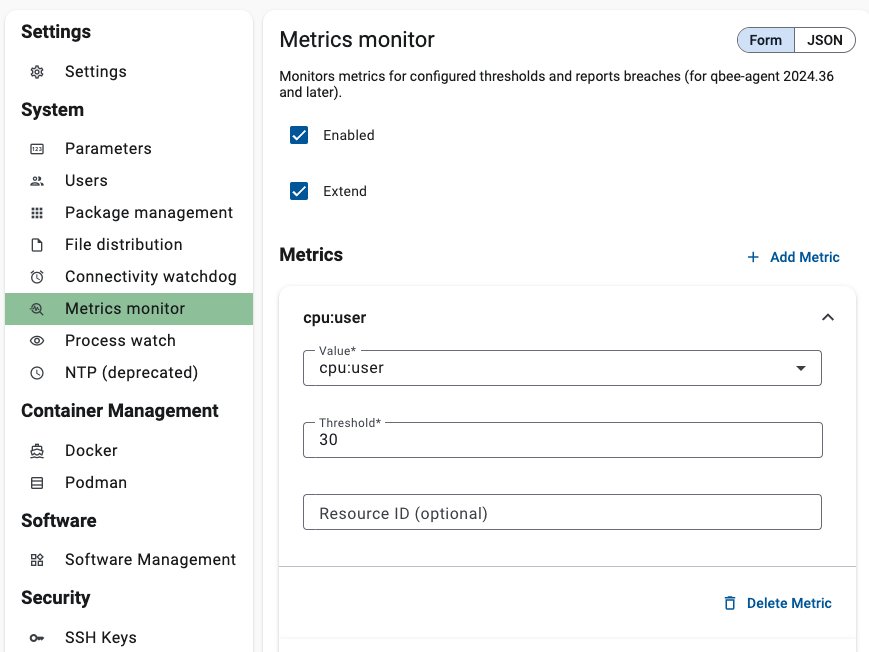
Example: Setting a threshold for cpu:user
On the following screenshot we define 30% load for the cpu:user metrics.
Log messages example:

