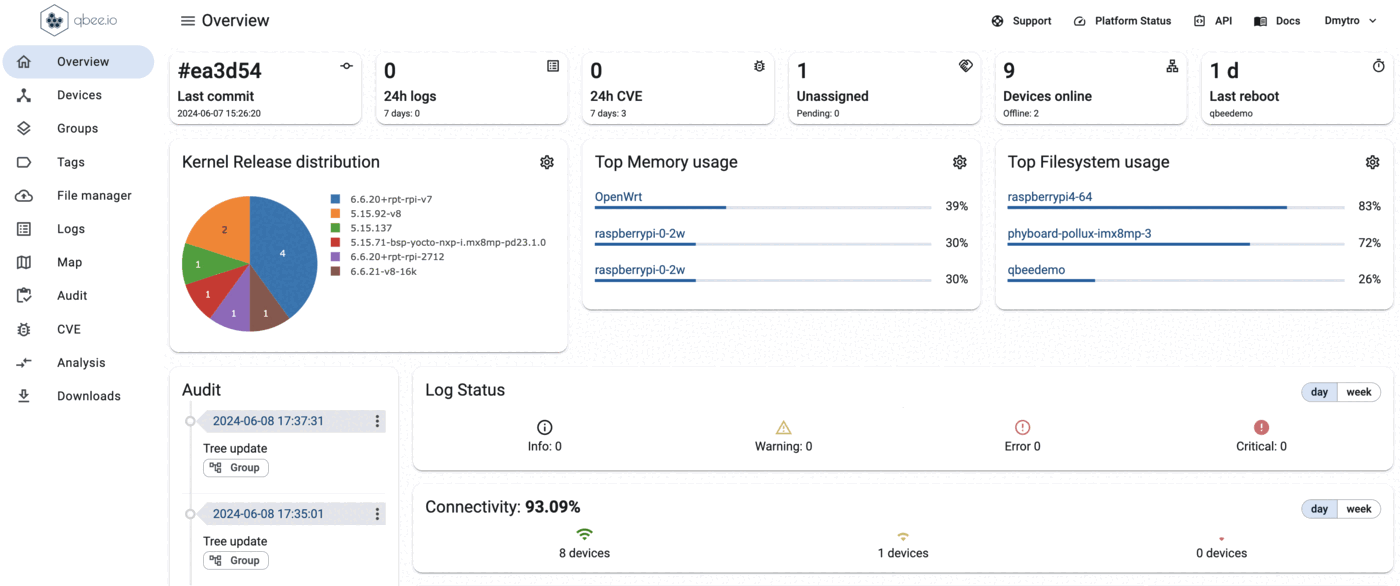
Main dashboard
The main monitoring dashboard of the platform can be found under "Overview" in the menu on the left. Here many parameters of the platform are visualized. The overview is very much self-explanatory but some items can be configured:
The second line of widgets shows Top CPU, Memory and Filesystem widgets as default.
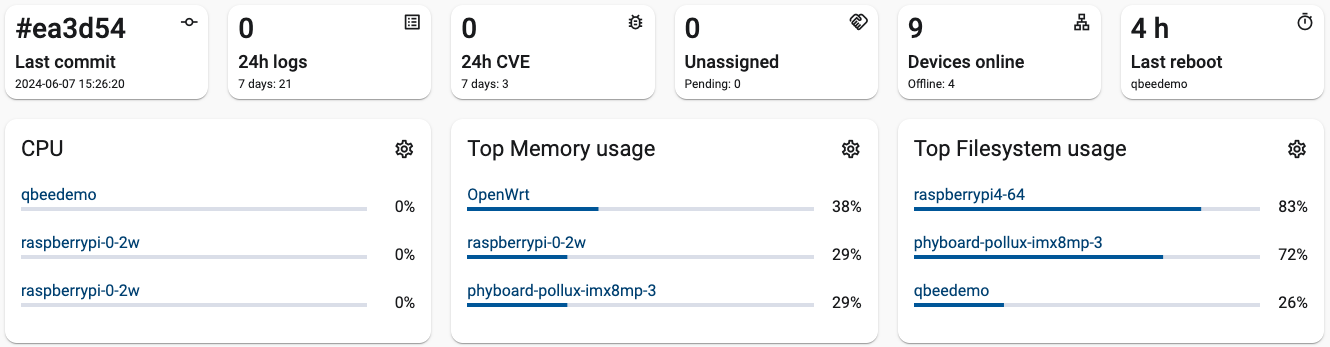
By clicking the COG symbol in each widget a dialogue is opened. Here different visualizations can be selected.
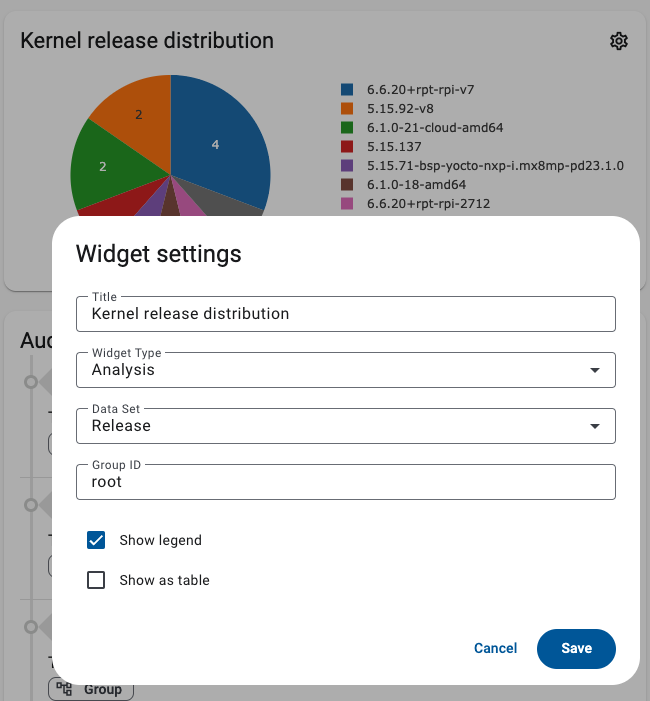
The "Analysis" widget type allows to select different visualizations that will be continuously extended. Select a title, the data set and use a "Group ID" in order to define if you want to display this for the whole fleet or a specific group or subset. Please note that the "Group ID" for the top level of the tree is root. Any level below that needs to be described as a group ID. This ID is obtained by clicking on the desired group in the "Groups" page. In the URL of your browser you will find the group ID. One example could be this URL: https://www.app.qbee.io/#/groups/id/2086ccb5-6958-4fe9-9063-b419ee3f3b4e/overview The string 2086ccb5-6958-4fe9-9063-b419ee3f3b4e is needed for the "Group ID".
Options for the widget are to display it with or without legend and as a table or pie chart. This is for example useful to visualize the distribution of different kernel versions in association with OTA updates. Log status is giving insight into events for the last 24h or 7 days.
The connectivity status is very useful in determining whether devices are moving to online or offline.