Fleet organization strategies
Device management is often used for large fleets. Thus it makes sense to divide the fleet into different parts in order to make managing and customizing the devices easier. The best way of doing this is really depending on the use case, but the tool offers the concept of groups and tags to handle this.
-
Groups: With groups a tree structure can be created. Sub groups can branch further and thus different customers, locations or other concepts can be implemented. In a group tree it is possible to inherit configuration to sub groups, extend the configuration or also break it and thus making the branch independent.
-
Tags: Tags can be seen as a concept that allows an overlay to groups giving devices in different branches of the tree a common way of addressing exactly these devices based on a given tag. But tags can also be used exclusively without using groups.
In addition, there are ways to define, search and handle devices. Let's start with this.
Devices
Add new devices
Devices can be added by bootstrapping. In the devices tab we also offer a button "add devices" which will display the command for running docker virtaul devices again or to install the agent on real hardware.
Changing custom device name
The device name can be changed in three different ways. Per default a custom device name is used which always overrules a host name. If no custom name is given, or host name is selected, the host name is used. This can be set in "Profile".
-
UI based: Go to any device and click on the pen symbol.

-
Use the API to set the custom host name
-
Set a custom device name while bootstrapping with this flag:
--device-name DEVICE_NAME
Setting location
Device location can be set under the location tab in the "Devices" menu which is extended when clicking on a specific device. Per default an IP localization is done, but this can be overridden with coordinates or by seraching for a specific address. If you don't want IP localiation just set random coordinates.
Searching
The device tab has many options to search for devices. These can be selected by pressing the button next to the selector field. Please note that "description" is a free form field that can be used for various annotations and specific device data. Any search can be turned into a filter by pressing the icon besides the selector. Filters can be removed again
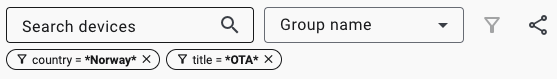
Any search can simply be shared with colleagues or bookmarked by pressing the blue symbol on the right. This copies a link url containing all search selectors.
Groups
This method creates a group tree and allows to work with inheritance. How inheritance works is explained here. By default, all new devices are enrolled in the group "All devices". This is the root of the tree and if groups are not used then this is just showing all devices under that group.
Groups can be browsed and filtered in the "Groups" menu.
Creating groups & browsing
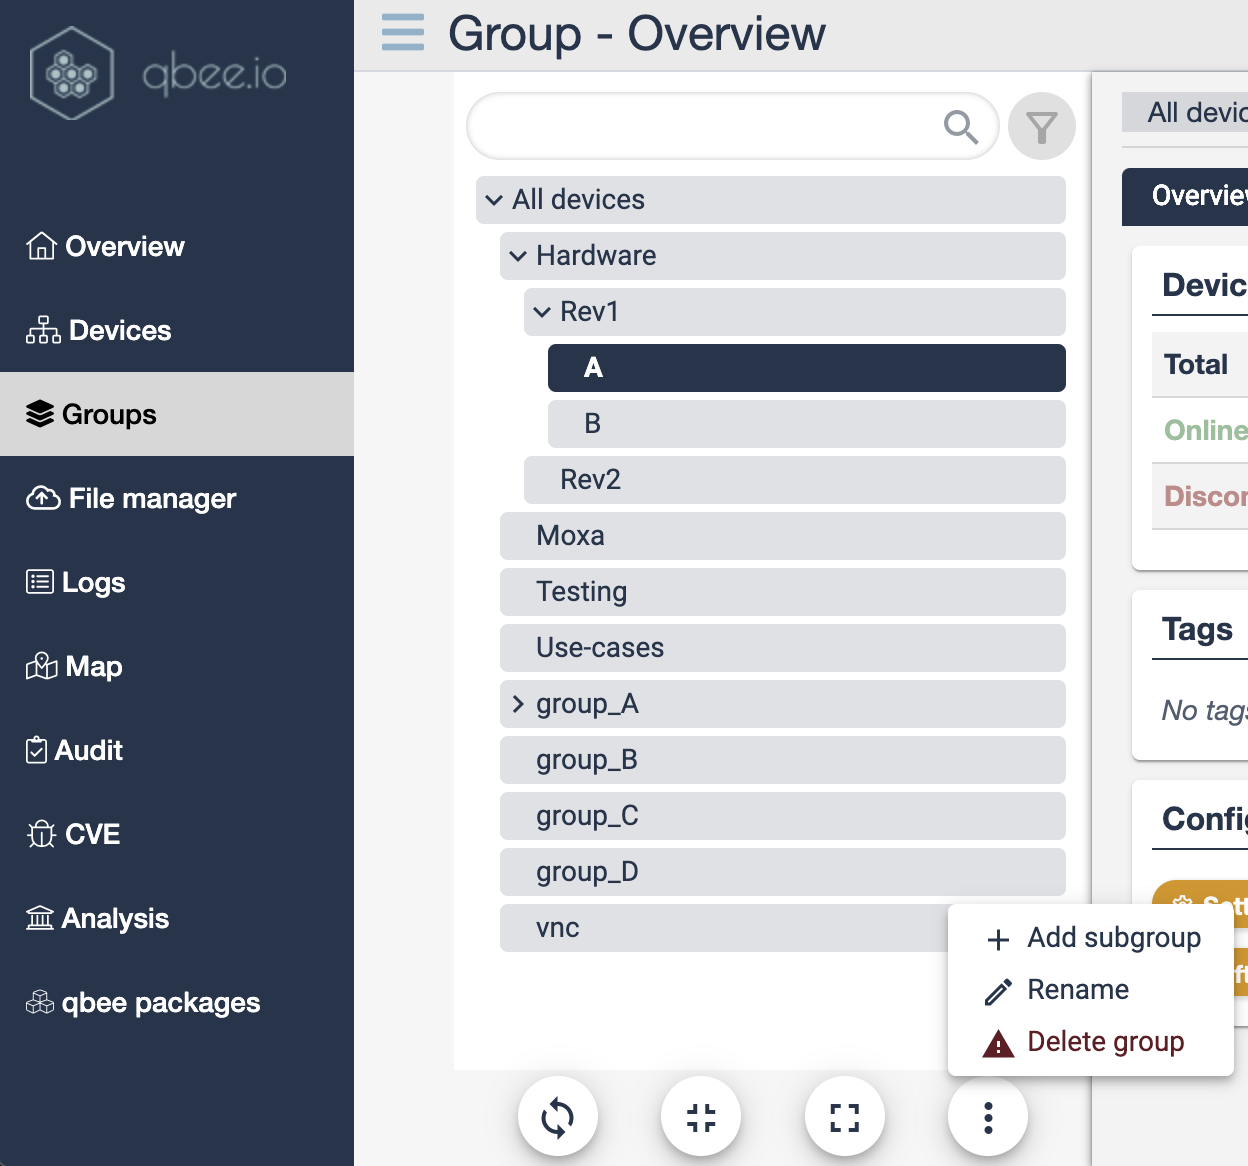
The groups menu offers the possibility to create any tree with multiple subgroups. Clicking on the icon with the three dots offers the option to "add subgroup", "rename" or "delete a group". Moving groups is not supported.
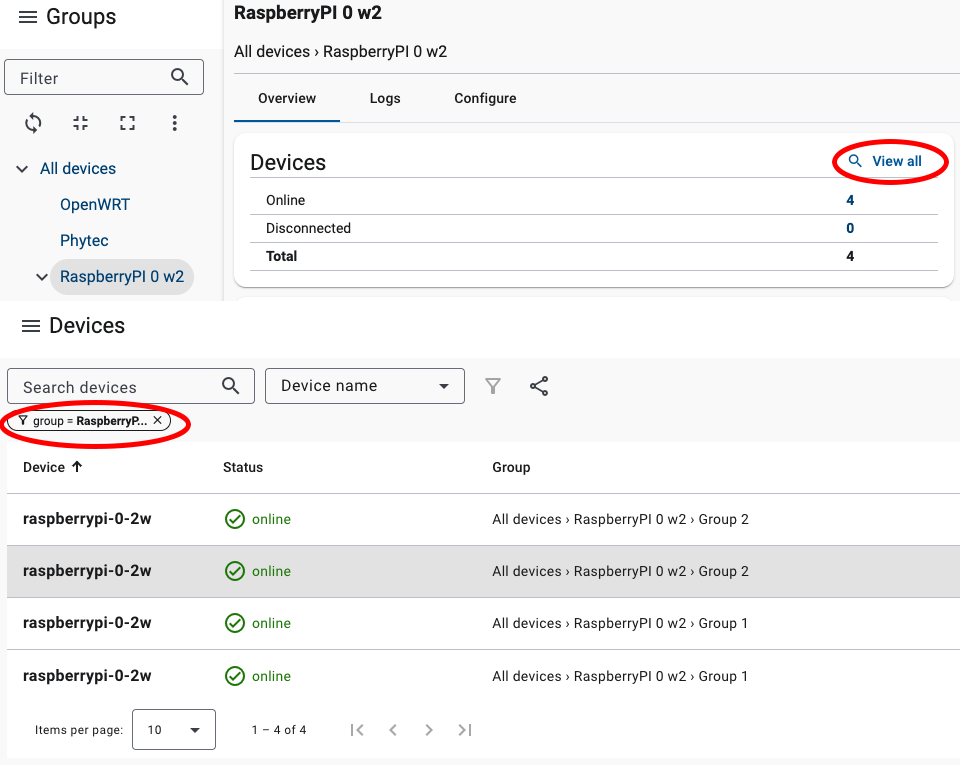
Groups can be searched through the search button. This allows to navigate large trees. Anytime a group is in focus the information on the right hand side contains information about all devices appearing in the branches below. Likewise, the logs and configure items are also displayed for the group level.
Sometimes it is interesting to see which devices are part of a group. Selecting the group of interest and pressing "view all" will jump into the device tab with the according filter on. Using the back navigation of the browser allows for a quick return to the group page.
Moving & deleting devices
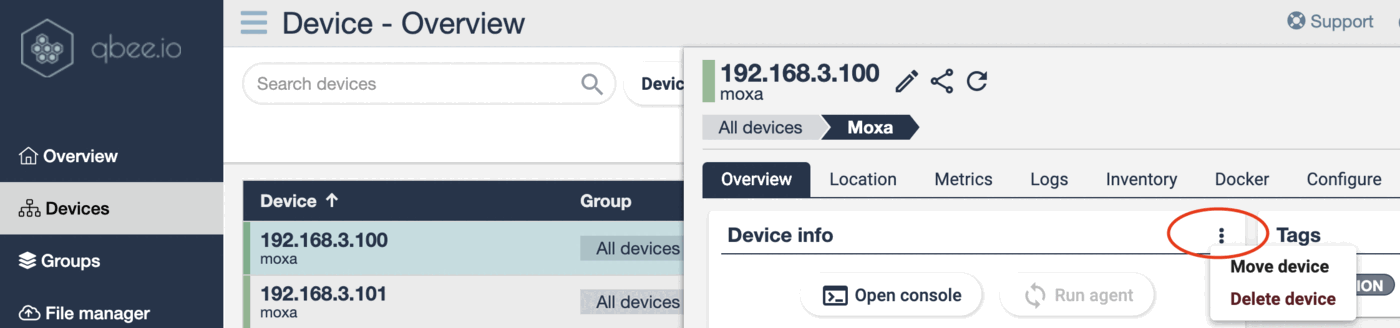
In the devices menu any device can be moved or deleted. Select the targeted device by clicking on it. This opens the information form to the right. In the "Device info" section there are three dots that offer the additional menu to move or delete the device.
Tags
Tags are used to organize devices by common attributes, such as location, a specific customer, a particular type of hardware, or any other characteristic shared by a group of devices. Tags can be utilized alongside groups or exclusively. Each group or device can have up to 10 tags.
Creating tags
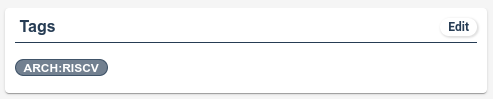
There is no need to create tags in advance. They can be added to any device or group directly by clicking the "edit" icon in the tags section on the device's or group's details page. This action opens a dialog where tags can be both added and removed.
Tags may include alphanumeric characters, dashes ('-'), and colons (':'). They are case-insensitive and must be between 3 and 64 characters in length.
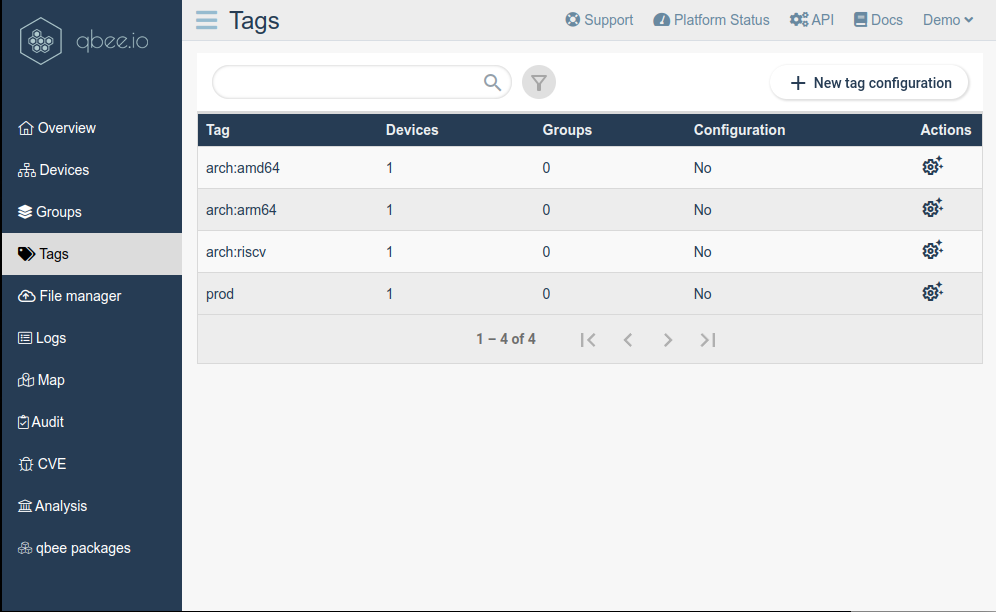
Tag-based configuration
Tag-based configurations can be applied similarly to group-based configurations. These configurations can be set up in the tags section by either selecting an existing tag or creating a new tag configuration by clicking the "+ New Tag Configuration" button.
Details on how tag-based configurations are extended and/or inherited are outlined in the configuration inheritance section.
Rebootstrapping devices
Sometimes it can be useful to rebootstrap one or many devices. You might need to move them between different accounts or you just want to test something. This can be easily achieved like this:
Run the following commands (as root) on command line or include them in a script:
# sudo systemctl stop qbee-agent
# sudo rm /etc/qbee/ppkeys/qbee.key /etc/qbee/ppkeys/qbee.cert
# sudo qbee-agent bootstrap -k <bootstrap-key>
# sudo systemctl start qbee-agent
Obviously these need to be included in a script if you want to do this on a large number of devices.
Considerations:
- you might want to open port 22 again before you stop the qbee agent
- when you stop the agent a reboot would start it again
- if the qbee directory has been removed the device cannot connect to the qbee backend anymore
- make sure you do not enter a state in which you loose remote access through qbee and CLI
Deleting devices
The correct way to delete a device is to also uninstall the agent from the device. This mandates that the agent is uninstalled first and then the device is removed in the application to prevent that the agent will continue to run on the device.
On the device please issue the following commands (below you see how to do this with automation).
 apt-get --purge remove qbee-agent
 rm /etc/qbee /var/lib/qbee -rf
This will stop and remove the agent software as well as the keys and specific data.
As next step the device can be deleted as described above.
How to uninstall the agent through automation
It is very easy to uninstall the agent even on a large device base. This is in line with our philosophy that we do not want to lock in any user. We do this through the included automation engine that the platform provides and it works like this:
-
Upload your uninstall script to the file manager
uninstall-qbee.sh```bash #!/usr/bin/env bash apt-get --purge remove qbee-agent rm /etc/qbee /var/lib/qbee -rf exit 0 ``` -
In the web app go to "Configure" and select "File Distribution".
On the device tab select the group or device that is in scope. For more information please see the configuration management documentation.
-
Set up the file distribution:
File Source:
/uninstall-qbee.shFile Destination:
/home/pi/uninstall-qbee.shand we need a command to run that executes this on the remote devices. Since we want to keep record that this really went OK we pipe the output of the script in a log file as follows:
bash uninstall-qbee.sh > qbee-uninstall.log 2>&1 -
Save and commit this configuration. Now within your agent interval (usually 5 minutes) all devices will uninstall qbee. Since the agent is stopped and removed you will not see any report logs this time.
-
Remove the devices in the web UI