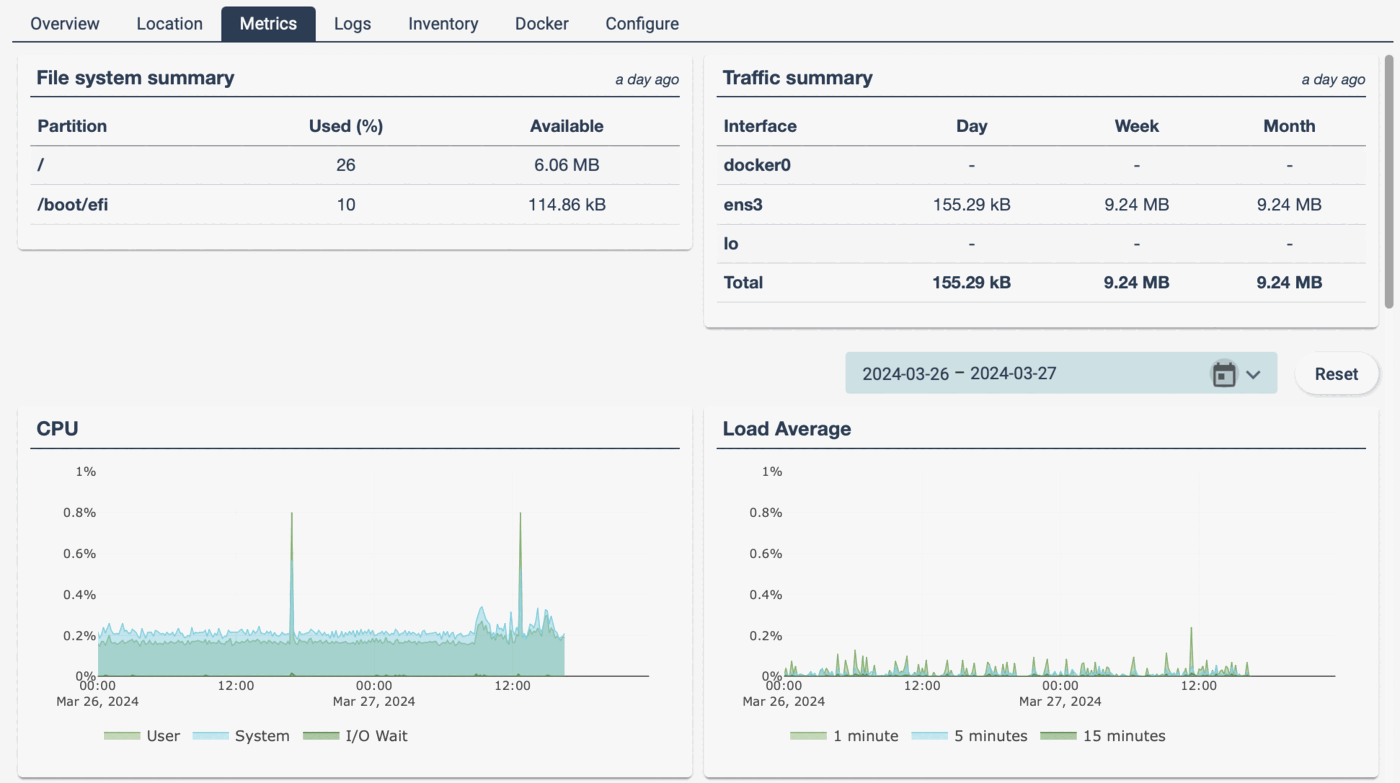
Metric reports

qbee enables remote edge devices to be monitored with ease by allowing the collection of metrics. This includes CPU load, memory, disk usage, bandwidth, and other key parameters. By proactively monitoring the system, potential issues can be identified before they arise. Thresholds can be set, and alerts will be triggered if those thresholds are crossed. Additionally, users can browse past metrics and adjust the time window of the graphs using the time selector. Metrics can be accessed via the "Graphs" tab in the "Devices" menu.

Zoom

By opening a rectangle with your mouse you can zoom in into interesting areas.
Double-clicking into the graph allows you to get out of zoom mode.

qbee-metrics-all

This collection of metric data helps to identify anomalies and deviations, such as memory leaks or excessive logging. Remote metric collection enables the identification of performance issues early on and ensures the security and hardening of the IoT edge infrastructure.

qbee transmits one value per agent run, with intervals ranging from five minutes to 24 hours. Data points are aggregated into larger buckets for intervals longer than 24 hours, which may impact the appearance of the bandwidth graph.

The bandwidth graph is the latest extension to our metric graphs, displaying all interfaces for rx and tx, as well as a combination of total traffic. This helps to analyze and monitor system network behavior, optimizing performance and identifying unexpected bandwidth demands. Customers use this to estimate data package needs for mobile network connections.

qbee-metrics-bw