Deploy multiple Node-RED Docker containers with Linux device automation and management
In short
In this tutorial we show you how to set up a Node-RED docker service combining InfluxDB and Grafana using qbee.io's powerful configuration management.
The general idea is to build a pipeline, where time-series data is generated by Node-RED and ingested into an InfluxDB database. Additionally, Grafana is used to read the data from the database and create a live plot. All three services run inside Docker containers. So the output will be a dedicated Node-Red docker container, an InfluxDB docker container and a Grafana docker container.
qbee.io is also used to configure the three services such that they can communicate with each other. Furthermore, we utilize qbee-connect to access the services from our local machine. All this is done fully automated and through remote management.
We provide all the necessary files in our GitHub repository and show in the last section how to automate this process.
Infrastructure
The following image sketches the infrastructure we are going to set up.
Core services
- Node-RED: set up of flows to generate time series data (here artificially generated)
- InfluxDB: database to store the time series data from Node-RED
- Grafana: visualize the time series data by accessing the InfluxDB database
Availability services
- Docker: run Node-RED, InfluxDB and Grafana in separate containers and forward ports to the host system (embedded device)
- qbee.io: configure Docker setup and provide user data for the containers
- qbee-connect: map ports from the embedded device to the local system to access the services running inside Docker containers
Setup of the docker containers
In the following we explain the setup steps in detail for the individual services. The directory structure is as follows:
directory structure
|-- grafana-data
|   |-- provisioning
|   |   |-- dashboards
|   |   |   |-- examples
|   |   |   |   `-- sine_wave.json
|   |   |   `-- dashboards.yaml
|   |   `-- datasources
|   |       `-- datasource.yaml
|   `-- provisioning.tar
|-- influx-data
|   `-- init-influxdb.sh
|-- nodered-data
|   |-- flows_cred.json
|   |-- flows.json
|   `-- settings.js
|-- nodered-image
|   `-- Dockerfile
|-- alldata.tar
|-- docker-compose.yaml
Node-RED docker container
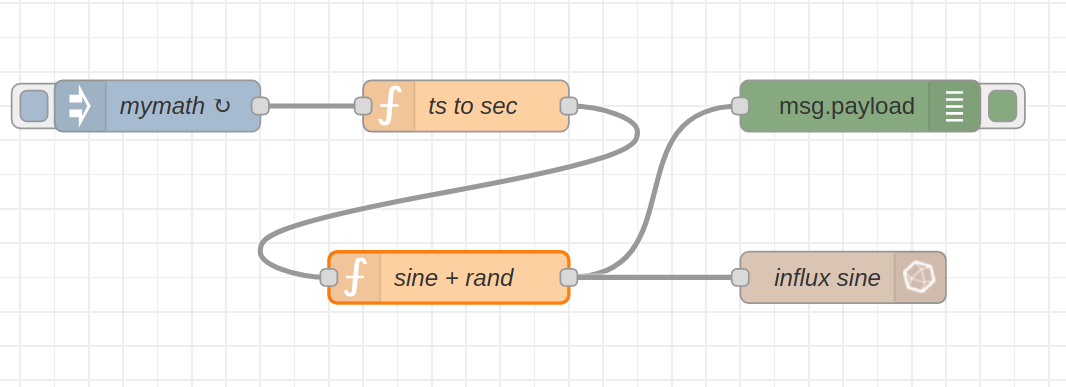
Essentially the Node-RED configuration requires a flow file and settings. Below you can find our example flow, where we create an artificial signal based on a sine wave overlayed with white noise. The output is written into the an influx database.
For this flow to work there are several configurations to be made:
- the influx nodes are not part of the standard installation
- the credentials of the influx database need to be passed such that the data can be written
The influx credentials have to be created from within the corresponding Node-RED node. However, once that is done, they can be shipped with the (encrypted) configuration files, therefore they do not have to be recreated.
We will address these two issues (package installation and configuration shipment) in the Docker setup section.
InfluxDB docker container
We need to create a database where the Node-RED application can write into and the corresponding read and write users for that database. As the Grafana application accesses the data written by Node-RED it makes sense to have a read-only user. As we write a lot of data and we are only interested into the last values we show how to create a retention policy to keep the data only for 1 hour (or whatever time you like :) ). Of course the database does also require an admin user.
We will address the database setup in the Docker setup section.
Grafana docker container
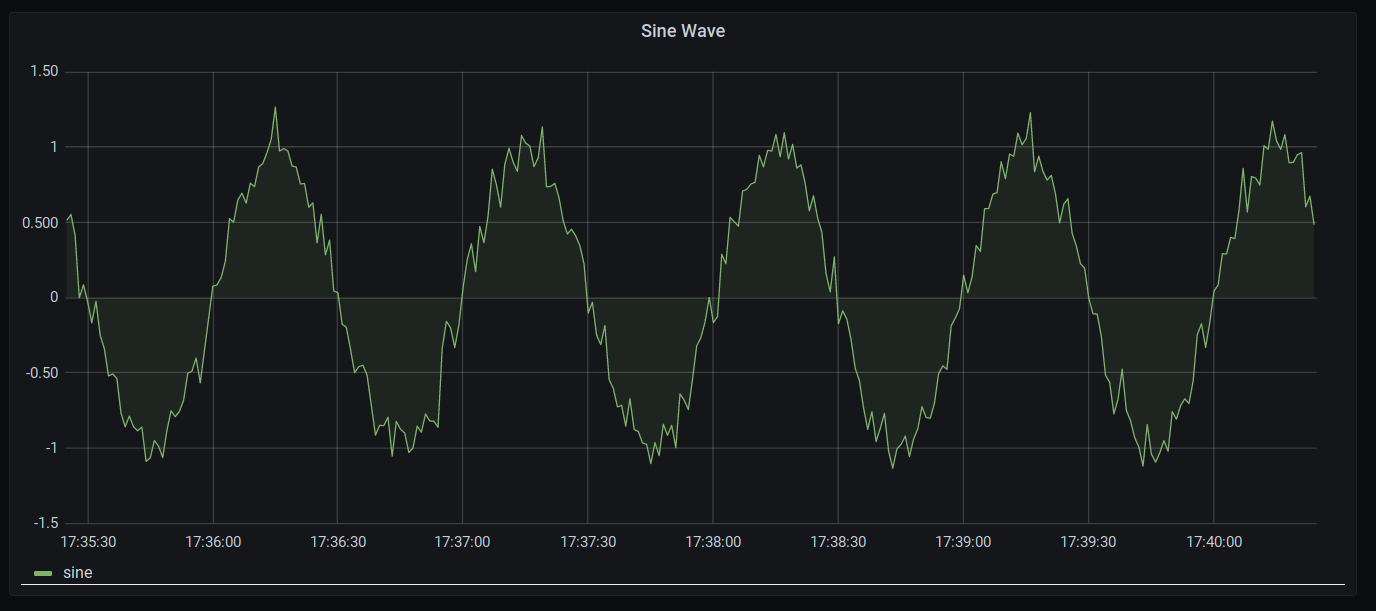
Below you can find the plot created by Grafana from the data written by Node-RED.
In order to obtain such a plot, several steps are necessary:
- access to Grafana: credentials
- the data source (here InfluxDB) has to be provided: Grafana allows for data source provisioning
- the actual plot should not have to be recreated: Grafana allows for dashboard provisioning
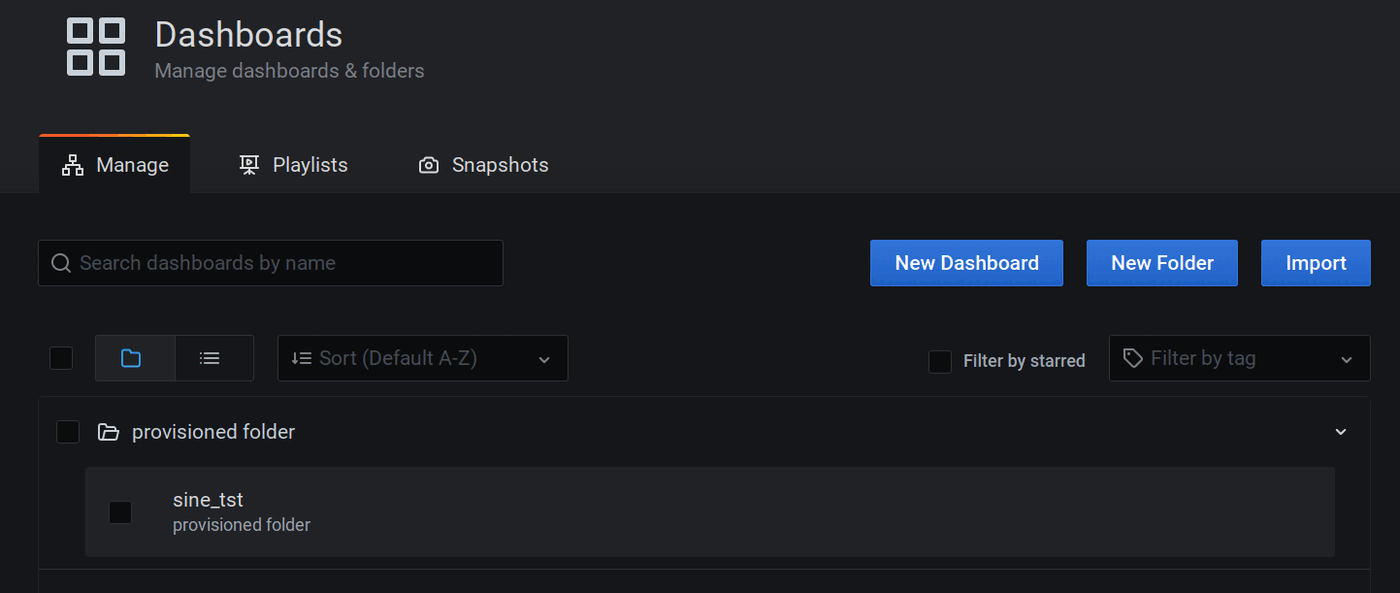
In the image below you can see that the dashboard we have shown above already exists in the container
We will address the setup of Grafana in the Docker setup section.
Docker
We are utilizing Docker as our central orchestration system for this demo case. All the above-mentioned applications run in separate Docker containers. We use docker-compose to facilitate the multi-container setup.
Since we do not want to fix all the configuration details in the docker-compose file and having to re-edit it all the time we make use of qbee.io's {{mustache}}-templating mechanism and provide "only" a templated docker-compose configuration file. This file will later on be expanded with the configuration values we desire.
The template configuration file is provided below:
docker-compose.yaml.tmpl
services:
    node-red:
        depends_on:
            - influx
        container_name: nodered-qbee
        build: {{nodered-image-path}}
        image: nodered-influx:{{nodered-image-version}}
        environment:
            - TZ=Europe/Amsterdam
            - FLOWS={{nodered-flow}}
        ports:
            - "{{nodered-port}}:1880"
        volumes:
            - {{nodered-data-path}}:/data

    influx:
        container_name: influx-qbee
        image: influxdb:{{influx-image-version}}
        environment:
            - INFLUXDB_HTTP_AUTH_ENABLED=TRUE
            - INFLUXDB_ADMIN_USER={{influx-admin-user}}
            - INFLUXDB_ADMIN_PASSWORD={{influx-admin-pw}}
            - INFLUXDB_USER={{influx-rw-user}}
            - INFLUXDB_USER_PASSWORD={{influx-rw-pw}}
            - INFLUXDB_READ_USER={{influx-read-user}}
            - INFLUXDB_READ_USER_PASSWORD={{influx-read-pw}}
            - INFLUXDB_DB={{influx-database}}
            - INFLUXDB_RETENTION_NAME={{influx-retpol-name}}
            - INFLUXDB_RETENTION_DURATION={{influx-retpol-duration}}
            - INFLUXDB_RETENTION_REPLICATION={{influx-retpol-repl}}
        volumes:
            - influx-storage:/var/lib/influxdb
            - {{influx-init-path}}/init-influxdb.sh:/init-influxdb.sh

    grafana:
        depends_on:
            - influx
        container_name: grafana-qbee
        image: grafana/grafana:{{grafana-image-version}}
        environment:
            - GF_SECURITY_ADMIN_USER={{grafana-admin-user}}
            - GF_SECURITY_ADMIN_PASSWORD={{grafana-admin-pw}}
            - GF_PATHS_PROVISIONING=/var/grafana-docker/provisioning
            - GRAFANA_INFLUX_DB={{influx-database}}
            - GRAFANA_INFLUX_USER={{influx-read-user}}
            - GRAFANA_INFLUX_PASSWORD={{influx-read-pw}}
        volumes:
            - grafana-storage:/var/lib/grafana
            - {{grafana-path}}/provisioning:/var/grafana-docker/provisioning
        ports:
            - {{grafana-port}}:3000

volumes:
    grafana-storage:
    influx-storage:
We provide an info box elaborating on the configuration file from above
Details on docker-compose.yaml.tmpl
-
node-redTo provide additional packages we create custom image. This is actually a very simple step as we take a base image (specified by the version number that has to be passed to the config) and add our desired add-ons to it. This step is explained below, where we introduce the templated Node-RED dockerfile.
Having defined the image, we specify the data directory to be mounted (again templated) containing the relevant flows. Finally we specify which flow the container should run through the
FLOWSenvironment variable. -
influxThe InfluxDB setup seems to have a lot of configuration. However, these are essentially just user and database creation.
As mentioned above, we want to create a retention policy to drop old data points within the database. To do so we have modified the entry-script
init-influxdb.shto account for that. Therefore we mount our modified script to the location of the original initialization script.As we want the InfluxDB data to be persistent even when a container is stopped, we create a docker volume and mount it in the container.
-
grafanaGrafana allows for some of the setup to be controlled with environment variables. Therefore the actual configuration files do not have to be overwritten. We make use of that by specifying the admin user as well as the location of the provisioning files (to provide data sources and share dashboards). The provisioning config files (
dashboards.yamlanddatasource.yaml) in turn allow to take configuration parameters based on environment variables. That is even though we upload those config files, their content is controlled via the environment variables passed by Docker (and since they are templated they are passed by qbee.io :) ). That is, theGRAFANA_INFLUX_*environment variables are read by thedatasource.yamlfile and establishes the connection to the influx container.Furthermore, we provide a docker volume for persistent storage of the Grafana database.
Below show the Dockerfile for our custom Node-RED container. As promised this is a very simple setup :)
Dockerfile.tmpl for Node-RED
FROM nodered/node-red:{{nodered-image-version}}
RUN npm install {{nodered-packages}}
We simply pass the version of the base container we want to install and provide the additional packages as template as well.
Custom Node-RED packages
There are also other ways to achieve the installation of custom add-on packages for a Node-RED Docker container. But the solution presented here is a very quick fix that does not require specifying an Dockerfile with a lot of additional configuration.
Provisioning via file distribution
To make our life a bit easier and also shorten this already long documentation we provide all data files for the container within a single tar package alldata.tar and run a command to unpack it. In the last section we show how to obtain that tar package from our GitHub repository and upload it into your file manager via an API call.
We fill the template fields required for the docker-compose.yaml.tmpl which is expanded to docker-compose.yaml and also the Dockerfile.tmpl (custom Node-RED image) which is expanded to Dockerfile into the appropriate directories.
Finally we run the command
docker-compose -f /home/pi/docker/docker-compose.yaml down && docker-compose -f /home/pi/docker/docker-compose.yaml up -d &
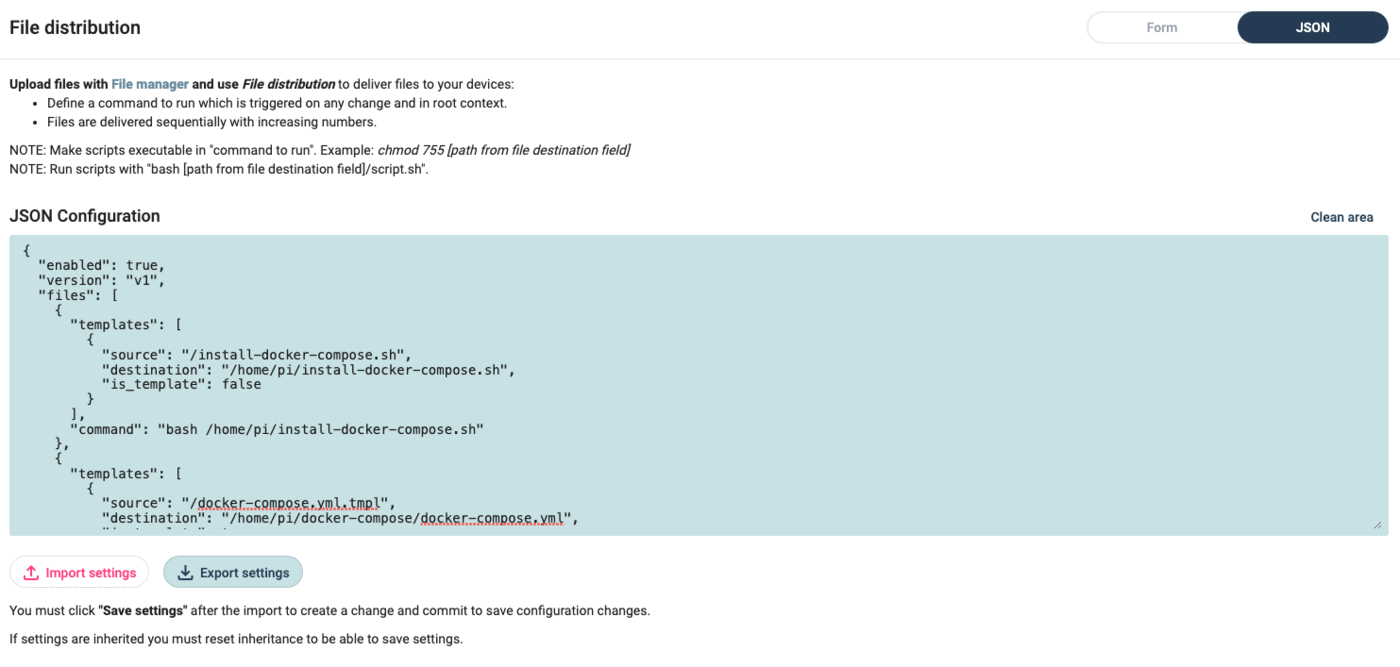
to start the services. Below we provide a rather lengthy configuration as json file which you can easily import through the specified field in file distribution (see image below).
file distribution configuration as json
{
    "enabled": true,
    "files": [
        {
        "templates": [
            {
            "source": "/docker-demo/docker-compose.yaml.tmpl",
            "destination": "/home/pi/docker/docker-compose.yaml",
            "is_template": true
            },
            {
            "source": "/docker-demo/nodered-image/Dockerfile.tmpl",
            "destination": "/home/pi/docker/nodered-image/Dockerfile",
            "is_template": true
            }
        ],
        "parameters": [
            {
            "key": "nodered-image-version",
            "value": "1.2.9-12"
            },
            {
            "key": "influx-image-version",
            "value": "1.8.4"
            },
            {
            "key": "grafana-image-version",
            "value": "7.4.3"
            },
            {
            "key": "nodered-image-path",
            "value": "/home/pi/docker/nodered-image/"
            },
            {
            "key": "nodered-flow",
            "value": "flows.json"
            },
            {
            "key": "nodered-port",
            "value": "1880"
            },
            {
            "key": "nodered-data-path",
            "value": "/home/pi/docker/nodered-data"
            },
            {
            "key": "influx-admin-user",
            "value": "admin"
            },
            {
            "key": "influx-admin-pw",
            "value": "admin"
            },
            {
            "key": "influx-rw-user",
            "value": "nodered"
            },
            {
            "key": "influx-rw-pw",
            "value": "nodered"
            },
            {
            "key": "influx-read-user",
            "value": "grafana"
            },
            {
            "key": "influx-read-pw",
            "value": "grafana"
            },
            {
            "key": "influx-database",
            "value": "firstdb"
            },
            {
            "key": "influx-retpol-name",
            "value": "one_hour"
            },
            {
            "key": "influx-retpol-duration",
            "value": "1h"
            },
            {
            "key": "influx-retpol-repl",
            "value": "1"
            },
            {
            "key": "influx-init-path",
            "value": "/home/pi/docker/influx-data"
            },
            {
            "key": "grafana-path",
            "value": "/home/pi/docker/grafana-data"
            },
            {
            "key": "grafana-admin-user",
            "value": "grafana"
            },
            {
            "key": "grafana-admin-pw",
            "value": "grafana"
            },
            {
            "key": "grafana-port",
            "value": "3000"
            },
            {
            "key": "nodered-packages",
            "value": "node-red-contrib-influxdb"
            }
        ],
        "command": "docker-compose -f /home/pi/docker/docker-compose.yaml down > /dev/null 2>&1 && docker-compose -f /home/pi/docker/docker-compose.yaml up -d > /dev/null 2>&1 &"
        },
        {
        "templates": [
            {
            "source": "/docker-demo/alldata.tar",
            "destination": "/home/pi/docker/alldata.tar",
            "is_template": false
            }
        ],
        "command": "tar -xvf /home/pi/docker/alldata.tar -C /home/pi/docker/"
        }
    ],
    "version": "v1"
}
qbee-connect port mapping
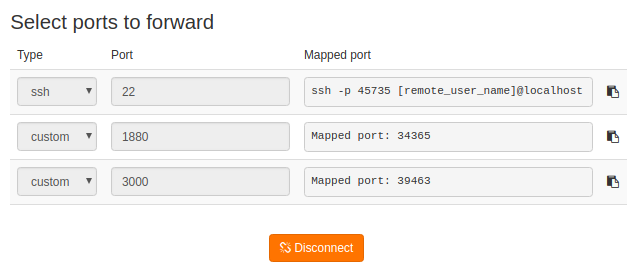
To access the services locally from your personal computer, you can run qbee-connect or qbee-cli. Just select the ports to be mapped, here 3000 for Grafana and 1880 for Node-RED as in the image below
From your local machine you can access the services via your browser typing in
localhost:34365
localhost:39463
GitHub repository as tar ball
We provide all the necessary data for this use case on our GitHub repository.
Quite conveniently you can obtain the contents of the repository as a tar ball via the following command:
curl -L https://github.com/qbee-io/docker-nodered-influx-grafana-demo/tarball/main > alldata.tar
The resulting file alldata.tar can be uploaded to your file manager in various ways, e.g.
- through the UI
- via an API call using our REST API
- via GitHub actions using our custom actions
tar balls from GitHub
If you download a repository from GitHub as a tar ball the files are contained in a folder like githubuser-githubrepo-somenumber.
To account for that (and remove the README.md file contained for the GitHub page) modify your tar command (within the qbee.io file manager command to run) as follows
tar -xvf alldata.tar -C /folder/to/unpack --strip-components=1 --exclude='README.md'
