


In many IoT projects edge processing is a crucial part of the overall solution. Then, a system integrator needs to make the decision if the edge application should run as a native application or in a containerised solution such as Docker. With qbee.io we support both solutions as we see distinct advantages and disadvantages for both solution approaches.
In this blog post we want to share a tutorial that gives you insights how to install, setup and configure an edge processing stack consisting of Node-Red, InfluxDB and Grafana. All this is deployed via Github and operated over the full lifecycle with our qbee edge device management solution. Thus this can be easily deployed, operated and maintained on thousands of devices.
The following image shows an overview over the architecture. We set all this up on a standard Raspberry Pi 3b+ unit but this will work on most Debian systems and can easily be ported to other platforms as well.
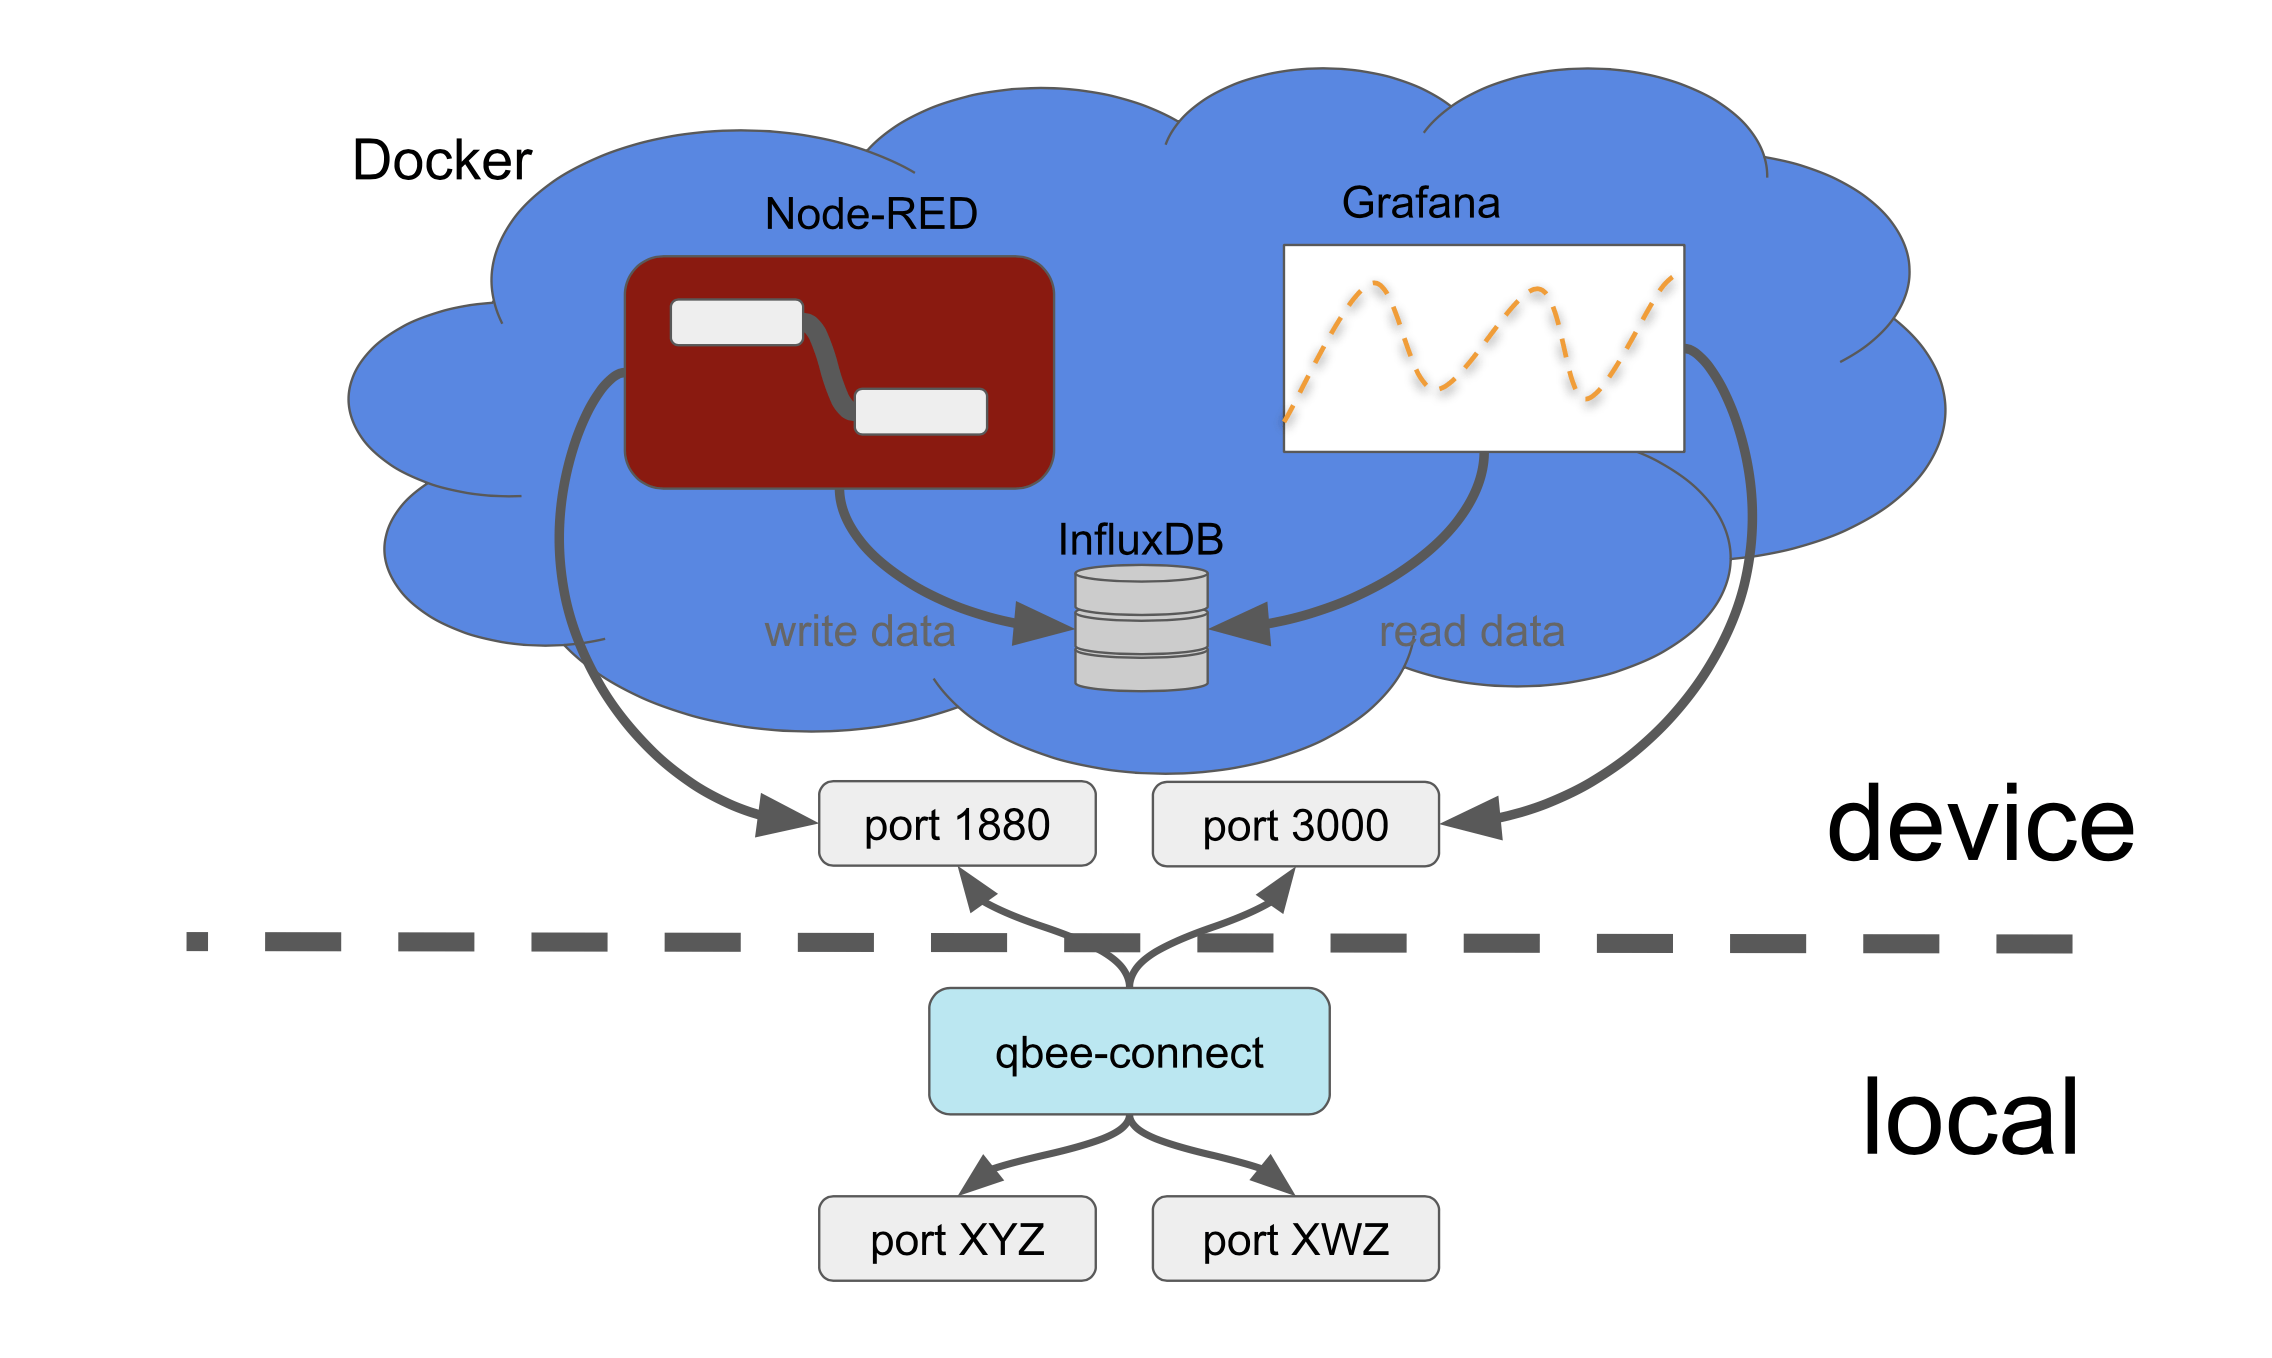
Core services
- Node-RED: set up of flows to generate time series data (here artificially generated)
- InfluxDB: database to store the time series data from Node-RED
- Grafana: visualize the time series data by accessing the InfluxDB database
Availability services
- Docker: run Node-RED, InfluxDB and Grafana in separate containers and forward ports to the host system (embedded device)
- qbee.io: configure Docker setup and provide user data for the containers
- qbee-connect: map ports from the embedded device to the local system to access the services running inside Docker containers
- Github: version control and file distribution repository. Linked to qbee.io via API.
The full tutorial can be found on our documentation page.
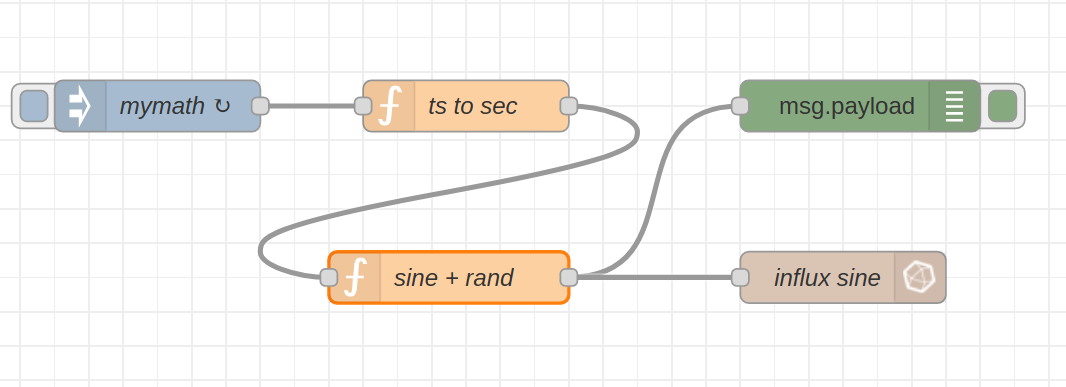
Node-RED
For Node-RED we setup a simple flow (including credentials) in one docker container and configure this to feed random graph data into another docker container running InfluxDB. A third docker container with a Grafana instance is then using the influxDB to query the data for its graphs. This is a very powerful stack that runs very well even on a small Raspberry Pi with limited memory.
Controlling InfluxDB, Grafana and automated deployment options
Databases can grow very large. This might not be something you want to have on the edge device. Therefore we allow you to customise the InfluxDB retention policy through the qbee UI and set it to 1 hour in our example. Through the qbee templating system and UI you can customise an unlimited number of settings. For this example we make the following settings available in a simple graphical UI (but also through the API) which can be defined on a device or group level:
{ “key”: “nodered-image-version”, “value”: “1.2.9-12” }
{ “key”: “influx-image-version”, “value”: “1.8.4” }
{ “key”: “grafana-image-version”, “value”: “7.4.3” }
{ “key”: “nodered-image-path”, “value”: “/home/pi/docker/nodered-image/” },
{ “key”: “nodered-flow”, “value”: “flows.json” },
{ “key”: “nodered-port”, “value”: “1880” }
{ “key”: “nodered-data-path”, “value”: “/home/pi/docker/nodered-data” },
{ “key”: “influx-admin-user”, “value”: “admin” },
{ “key”: “influx-admin-pw”, “value”: “admin” },
{ “key”: “influx-rw-user”, “value”: “nodered” },
{ “key”: “influx-rw-pw”, “value”: “nodered” },
{ “key”: “influx-read-user”, “value”: “grafana” },
{ “key”: “influx-read-pw”, “value”: “grafana” },
{ “key”: “influx-database”, “value”: “firstdb” },
{ “key”: “influx-retpol-name”, “value”: “one_hour” },
{ “key”: “influx-retpol-duration”, “value”: “1h” },
{ “key”: “influx-retpol-repl”, “value”: “1” },
{ “key”: “influx-init-path”, “value”: “/home/pi/docker/influx-data” },
{ “key”: “grafana-path”, “value”: “/home/pi/docker/grafana-data” },
{ “key”: “grafana-admin-user”, “value”: “grafana” },
{ “key”: “grafana-admin-pw”, “value”: “grafana” },
{ “key”: “grafana-port”, “value”: “3000” },
{ “key”: “nodered-packages”, “value”: “node-red-contrib-influxdb”}
All files, Node-RED flows, Grafana dashboards, InfluxDB configurations as well as the dockerfiles and docker-compose files are handled through Github. A Github runner action connects them through the qbee API with the qbee configuration management engine thus creating a continuous delivery pipeline with a very high degree of flexibility.
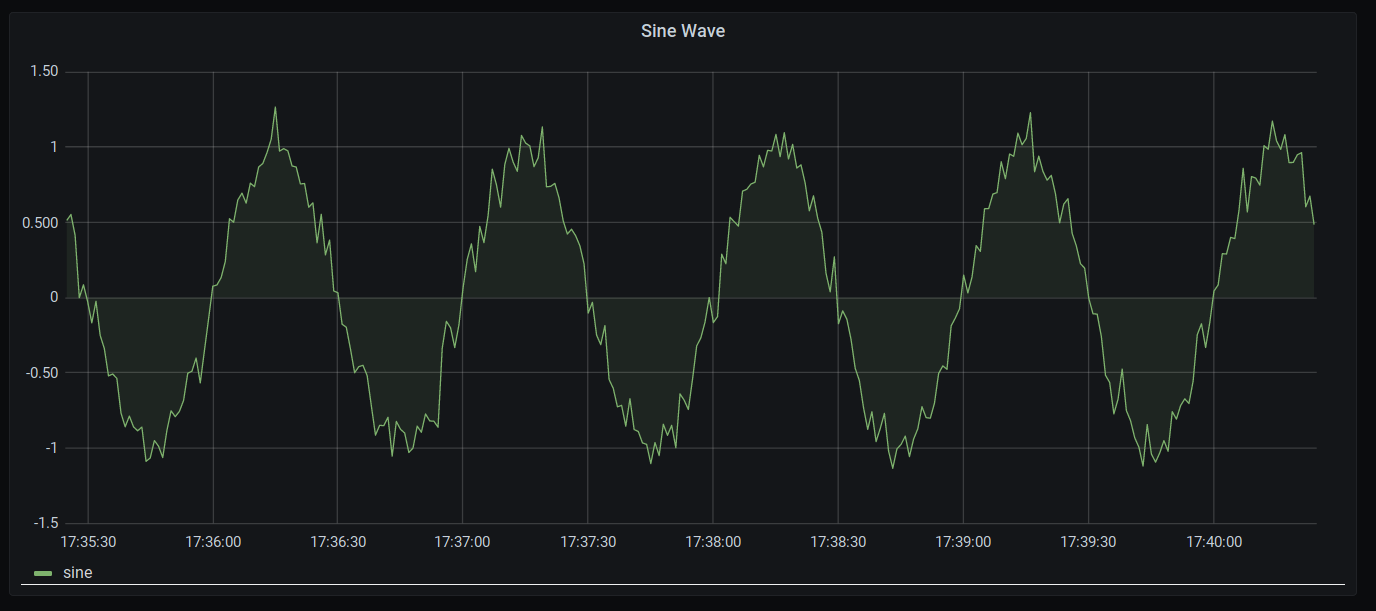
Grafana is used (with fully automated dashboards installed through the qbee setup process) to display the randomised sine wave as can be seen here:
Let’s assume this is an industrial controller gathering machine information for predictive maintenance. Now all the graphs and data as well as the Node-Red UI is accessible locally on the controller or maybe even within the local network if ports are open (we do not like open ports though). Both Grafana and Node-RED provide a graphical user interface over https. But how do you access this from the outside?
Secure remote access
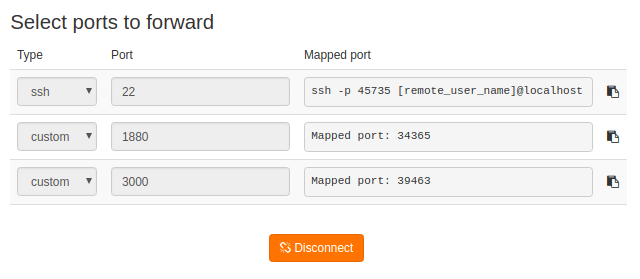
Here, qbee also provides a solution. With qbee-connect these ports can be securely accessed from the outside on your local machine running Windows, Linux or MacOS. This works through any firewall or NAT. The built-in highly secure VPN is able to route the ports of the remote edge device to a mapped port on your localhost or 127.0.0.1. The image below shows the qbee-connect UI and the mapped ports:
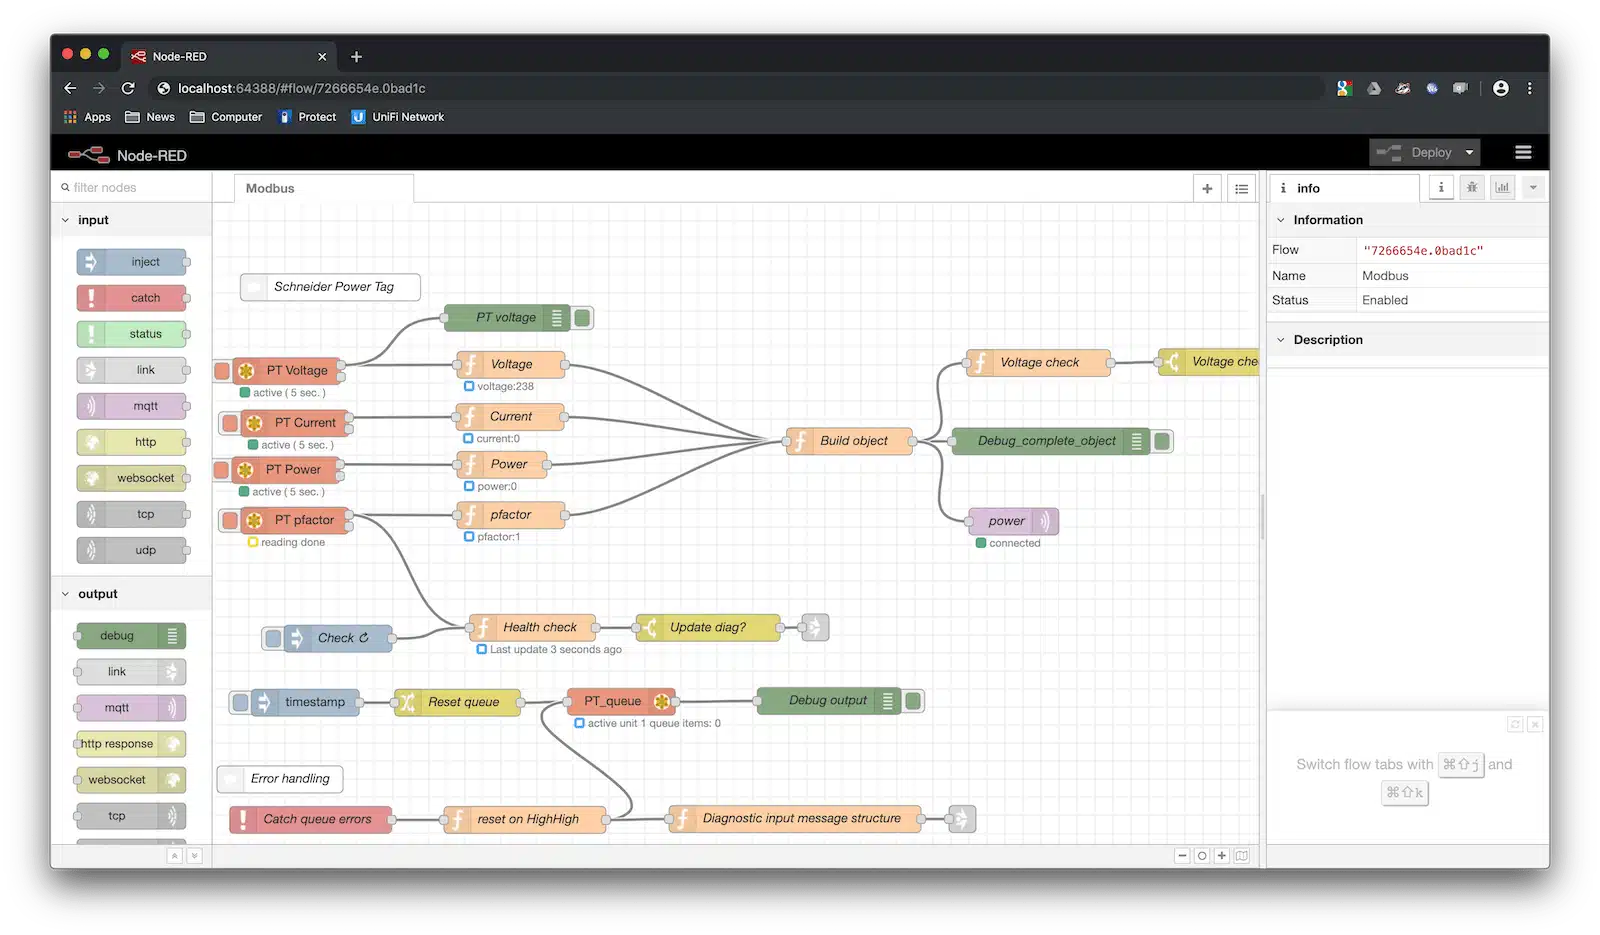
The following browser screen shows a remote qbee-connect access to another Node-RED flow doing some Modbus magic with a Schneider Power Tag. Note the localhost url with the mapped port.
Summary:
This blog post gives a short overview how we handled multiple docker containers on a Debian device. The installation and setup process is fully automated. Relevant configuration variables are exposed through the qbee UI and could also be accessed through an API. This allows to use different scenarios (different flow files, different Grafana graphs or different retention policies) for different groups of devices. Use the same technology stack centrally managed, but allow for different logic and UI representation for different machines, different smart buildings or just different customers that want different representations of their data. For a more detailed description of a Docker-InfluxDB-Grafana setup we would like to ask you to consult the full tutorial from the link. If you have questions or would like to discuss your project please do not hesitate to reach out to us.